Introduction
Aotearoa New Zealand (NZ) is a multicultural society characterized by significant ethnic diversity, with its population comprising 68% European, 18% Māori, 17% Asian, and 9% Pacific people.1 NZ has one of the largest Pacific diasporas globally, largely arising from post-war migration from Polynesian nations to urban centers such as Auckland.2 Reflecting this trend, Pacific peoples are projected to be among the fastest-growing population groups, anticipated to comprise approximately 11% of the national population by 2048.3
The burden of dementia in NZ is rising dramatically; the number of cases is projected to more than double from 82,900 individuals in 2025 to 167,400 in 2050.4 Critically, this growing public health challenge is not equally distributed across ethnic groups and disproportionately affects Pacific peoples.5 The estimated age- and sex-standardised prevalence of diagnosed dementia among Māori and Pacific peoples aged ≥ 60 living in NZ is almost double compared to European and Asian populations (6.3% in Pacific peoples and 5.4% in Māori, compared with 3.7% in European and 3.4% in Asian populations).5 Underdiagnosis exacerbates this disparity, as the true prevalence for dementia is likely much higher than the above figures, given that only around 50% of dementia cases are estimated to be formally diagnosed.6
These disparities are compounded by clinical presentations unique to Pacific peoples. They often present at a later stage of dementia but at a younger age compared to European patients.7 Moreover, they exhibit a higher proportion of potentially preventable dementia risk factors compared with Europeans, making early detection even more important.8 These findings highlight a disparity in dementia burden among Pacific peoples and underscore the need for improved diagnostic methods to help reduce inequalities in dementia outcomes. Timely detection of dementia not only allows for targeted interventions and lifestyle modifications to delay disease progression but is also crucial for enhancing equity in access to complex dementia care and reducing the disproportionately high unpaid caregiver burden borne by Pacific families.9,10
However, current diagnostic pathways for dementia are often time-consuming and geographically inequitable. This gap necessitates the rapid adoption of scalable solutions, such as Artificial Intelligence (AI)-assisted screening tools that can integrate into existing healthcare settings. We previously demonstrated the potential of using CTseg as a scalable dementia case-finding tool in New Zealand.11 CTseg is an extension of SPM12, a widely used neuroimaging software, to enable automated extraction of brain volumes from routine non-contrast CT scans using probabilistic models trained on both MRI and CT data.12,13 In our previous study, we analyzed deidentified CT brain scans from 168 NZ Europeans attending a memory service (89 with dementia and 79 without dementia). CTseg-derived total brain volume and hippocampal volume demonstrated moderate ability to distinguish dementia from non-dementia.11
Despite these promising initial findings, the performance of any diagnostic tool must be rigorously validated across diverse ethnic populations to ensure accuracy across the entire target demographic.14 The urban environment of South Auckland represents a hub for this demographic disparity, hosting the highest number of Pacific peoples in NZ, comprising approximately 27% of the local population, compared to around 9% nationally.15 Within South Auckland, the Pacific population is diverse, consisting of approximately 50% Samoan, 25% Tongan, 21% Cook Islands Māori, 8% Niuean, 4% Fijian, and 3% other Pacific groups.15 Given this demographic profile, a substantial number of older Pacific patients are referred to the local memory service, providing us the opportunity to examine how CTseg performs in a sample of Pacific patients and compare its utility to that found in the previous NZ European sample.
The aim of this study is therefore to evaluate the diagnostic accuracy of CTseg automated segmentation in identifying dementia among a sample of NZ-based Pacific peoples attending a memory service based in South Auckland.
Methods
Setting
This retrospective study analyzed deidentified data from consecutive patients of Pacific Island ethnicity routinely assessed at a memory service within a tertiary teaching hospital in South Auckland, NZ, between 2013 and 2022. Each patient underwent a comprehensive diagnostic assessment including, routine blood tests, cognitive assessment using the Addenbrooke’s Cognitive Examination III (ACE-III)16 or the Rowland Universal Dementia Assessment Scale (RUDAS)17 for non-English-speaking patients, a non-contrast CT brain scan, collateral history obtained from a care partner, and a structured clinical interview conducted by a memory service clinician. Diagnoses (including dementia subtype and severity where applicable) were determined by consensus at a multidisciplinary team meeting comprising a consultant geriatrician, consultant old age psychiatrist, geriatric registrar, psychologist, nurse specialist, social worker, and occupational therapist. Assessment of dementia severity was guided by Clinical Dementia Rating (CDR) criteria.18
Patients were included in this study if they had a CT brain scan within six months of diagnosis. This aligns with the memory service’s practice, where CT imaging may occur either before or shortly after diagnostic documentation, depending on referral pathways and multidisciplinary workflow.
Data Collection
We collected the following deidentified data from routinely collected data sources: (1) demographic information (age, gender, ethnicity); (2) residential address, which was used to calculate the 2018 NZ Deprivation Index (NZDep)19 an area-based measure of socioeconomic deprivation derived from census indicators of income, employment, housing, and education and (3) clinical diagnosis according to DSM-520 criteria and (4) CT brain scan.
All CT scans were carried out on either Siemens or Philips scanners using the routine non-contrast head protocol: patients were scanned head-first supine with 120 kV tube voltage and standard dose modulation. The scan spanned C2 to the vertex in a caudocranial direction with images acquired in 1-mm slices at 0.5-mm intervals. Raw data was reconstructed into 1 mm or 3 mm axial, coronal, and sagittal series and stored in the Agfa Impax PACS archive.21 CT studies were subsequently retrieved from PACS and imported into the Syngo.Via platform, where identifying metadata were removed and the de-identified images exported in DICOM format.22 These datasets were then securely transferred to the University of Auckland research environment using the HealthAlliance NZ ShareFile application.23
Image Processing
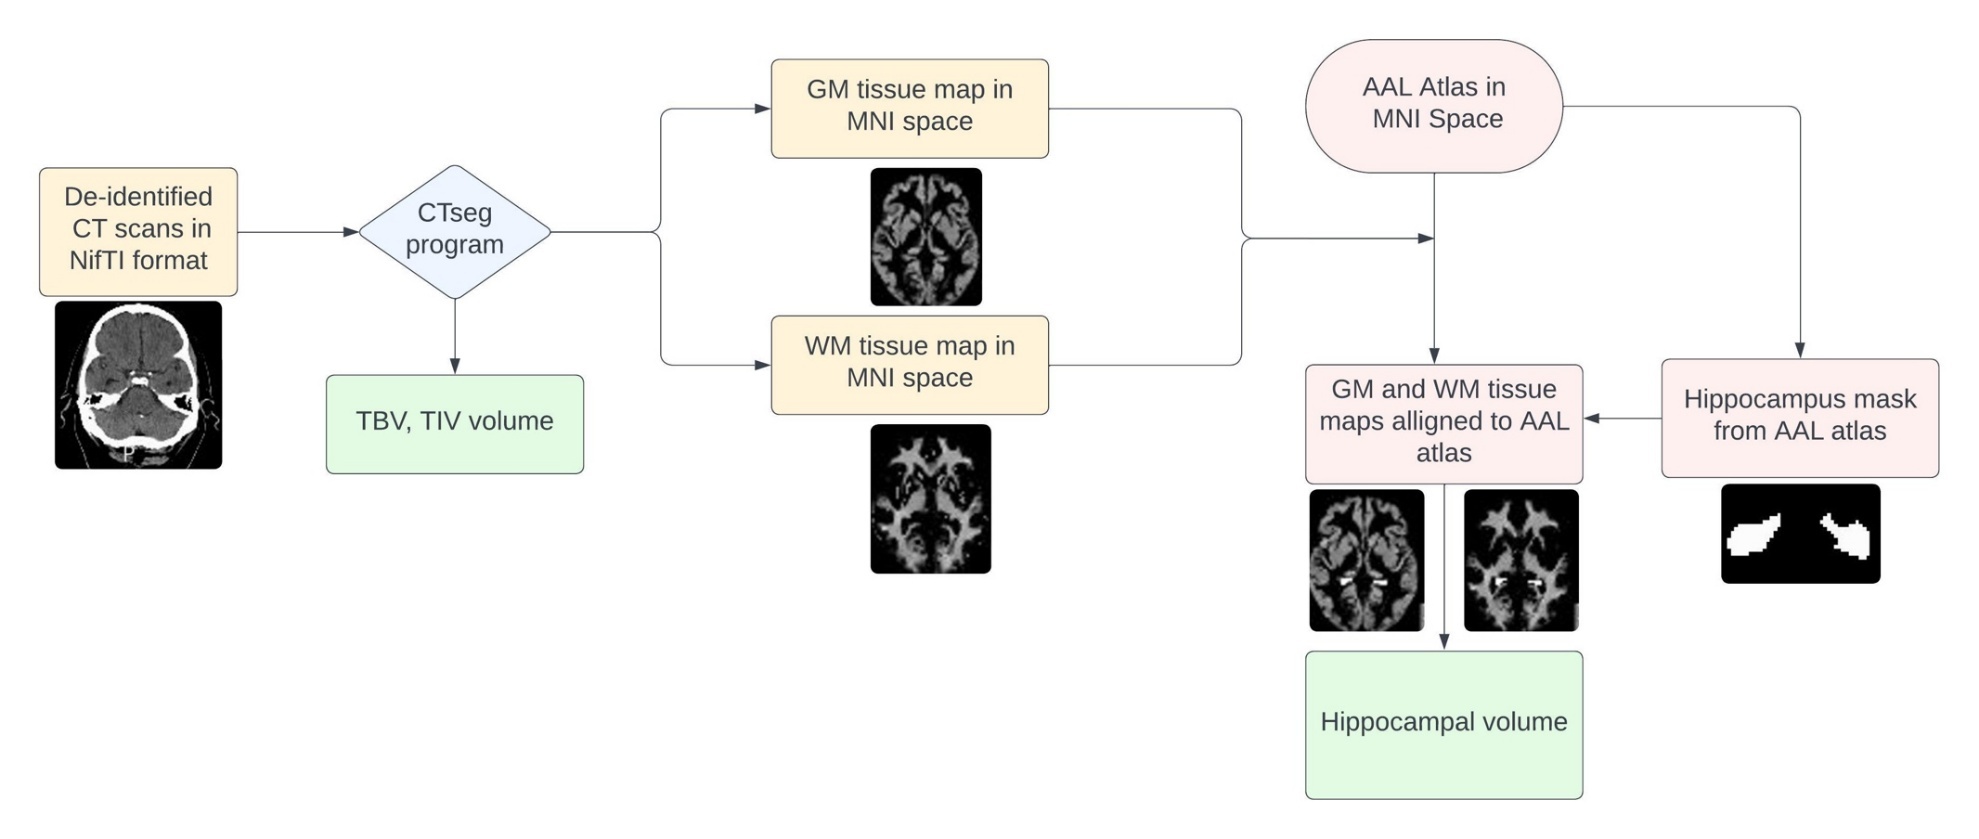
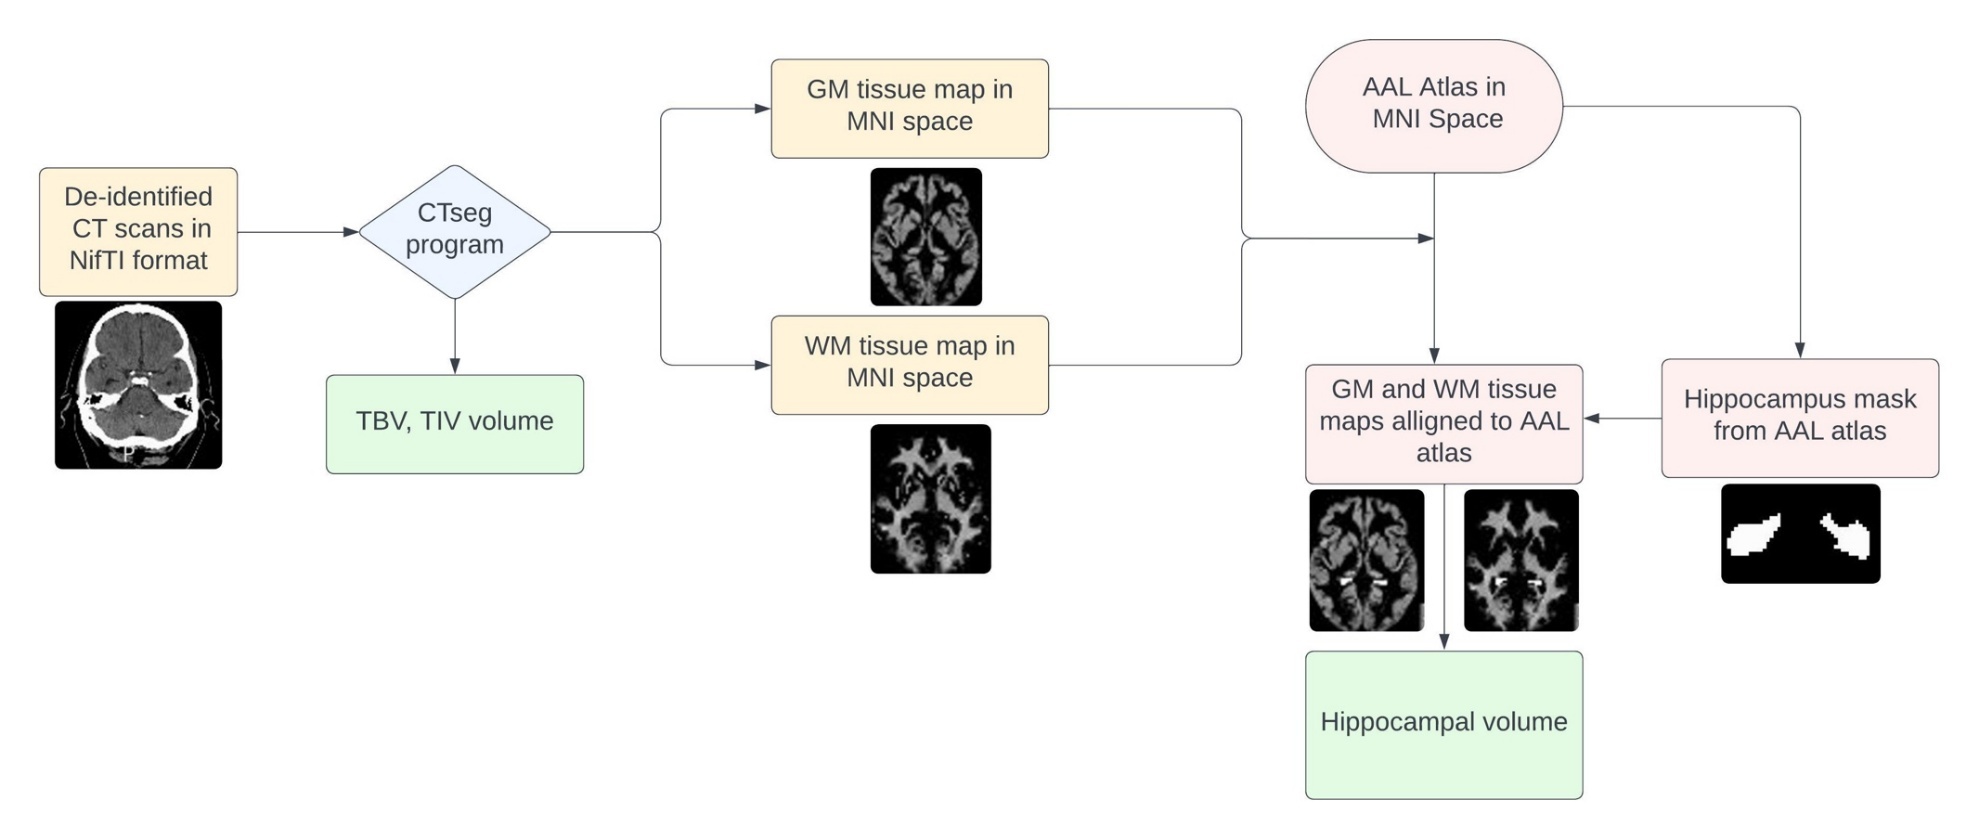
The spm_dicom_convert tool was used to convert the DICOM scans into NIFTI format, before they were analyzed using the CTseg pipeline. CTseg builds upon SPM12’s12 unified segmentation framework by including refined spatial registration procedures, Gaussian mixture model–based parameter priors, and an atlas derived from combined CT and MRI training data.13 This process yields volumetric measurements, including total intracranial volume (TIV) and total brain volume (TBV), as well as tissue maps: grey matter (GM), white matter (WM), cerebrospinal fluid (CSF), bone, soft tissue, and background tissues. To address any mask-fitting inconsistencies, images were spatially normalized to the Automated Anatomical Labeling (AAL) atlas.24 The hippocampal masks defined in the AAL atlas were then applied to calculate hippocampal volume for each scan. Segmentation outputs and mask alignment were visually inspected to ensure appropriate anatomical correspondence. All consecutive scans remained included in this analysis. (Figure 1 provides a schematic overview of this image-processing pipeline.)
Statistical analysis
The study participants were categorized into dementia and non-dementia groups. The dementia group included Alzheimer’s Disease dementia (AD), vascular dementia (VD) and mixed dementia (mixed Alzheimer’s disease and vascular dementia). The non-dementia group included Mild Cognitive Impairment (MCI) and no cognitive impairment. Baseline comparisons between the dementia and non-dementia groups were carried out using independent t-tests for continuous variables and Pearson’s chi-square tests for categorical data.
Volumetric measures, including TBV, HV, GM and WM, were examined according to dementia status, subtype, severity, age, NZDep and gender. Group differences in brain volumes between dementia and non-dementia groups, and between dementia subtypes, were analyzed using analysis of covariance (ANCOVA), adjusting for age and TIV to account for interindividual variation in head size. The Shapiro–Wilk and Levene’s tests were applied to assess normality and homogeneity of variance assumptions, respectively. The brain volumes for this Pacific patient sample were then compared with the previously reported NZ European sample from the same memory service which is summarized in Supplementary Table S1.11
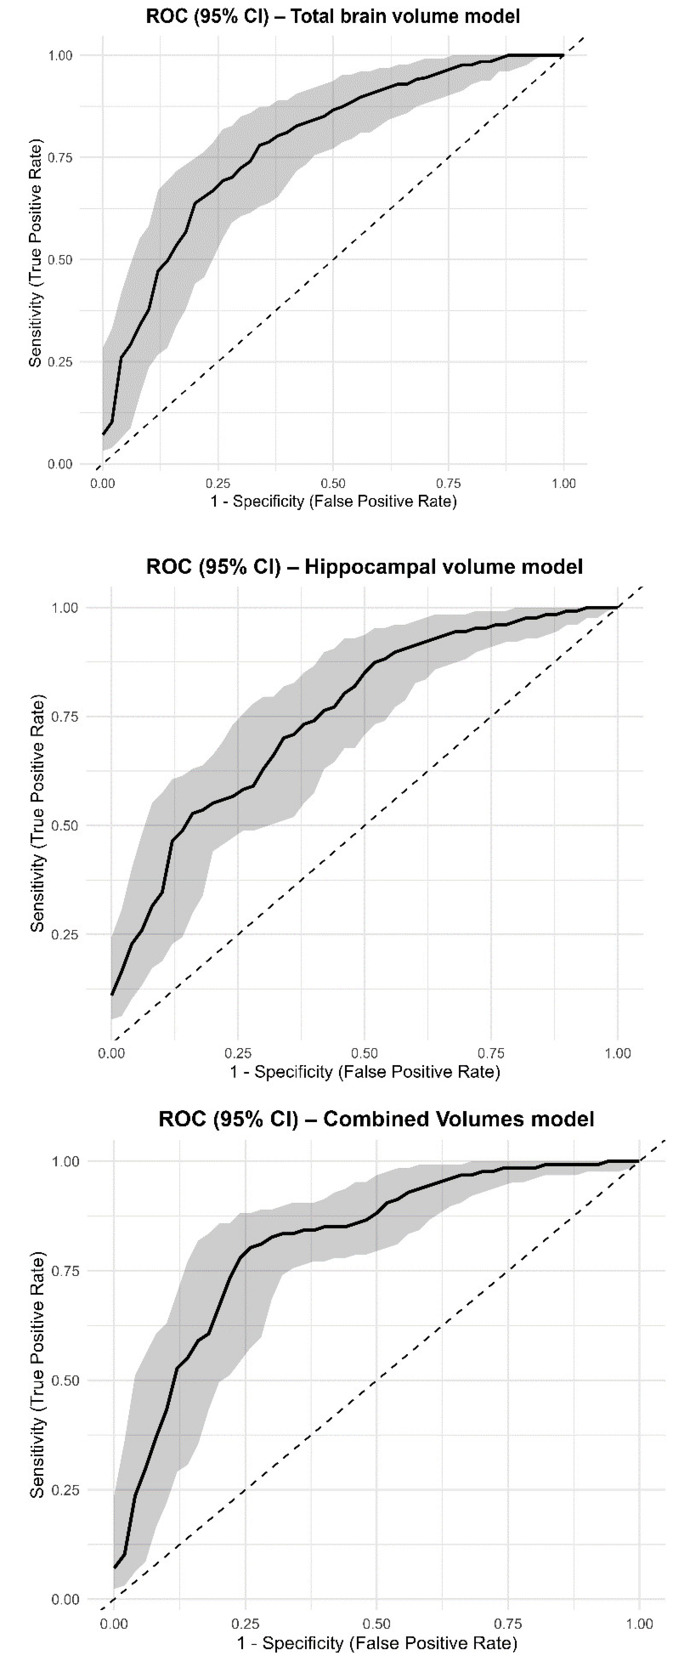
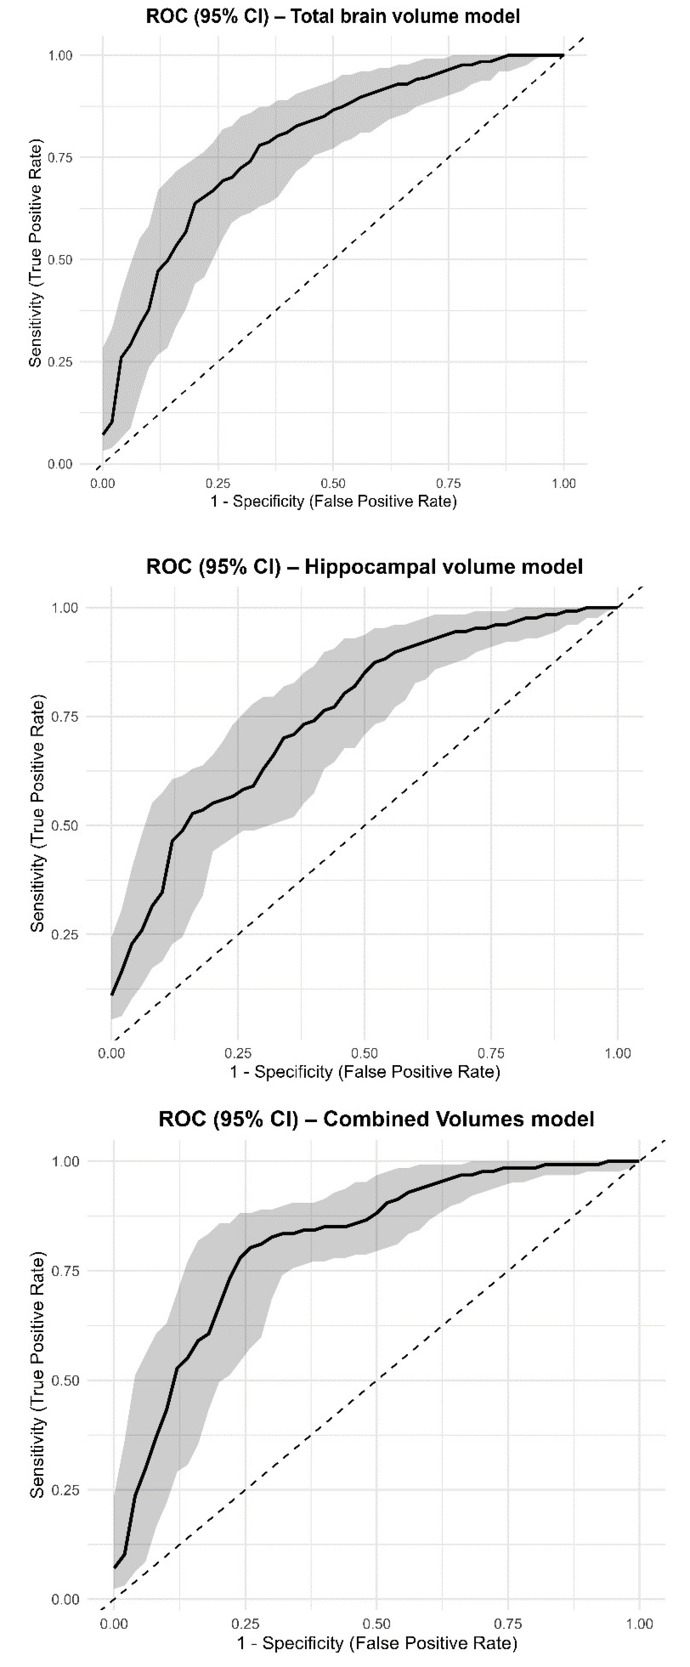
Associations between volumetric measures and dementia classification were modelled using logistic regression, controlling for age, TIV and interaction of brain volume and NZDep.25 Odds ratios per standard deviation decrease in brain volume were also computed. Classification performance was evaluated using both fixed probability thresholds (p = 0.5, 0.7, and 0.9) and the Youden index as the optimal clinically oriented threshold that maximizes the combined sensitivity and specificity.26 Performance metrics included accuracy, sensitivity, specificity, positive predictive value (PPV), and negative predictive value (NPV). To improve robustness of performance estimates, bootstrap resampling was used to derive 95% confidence intervals for performance metrics.27 Receiver operating characteristic (ROC) curves with 95% confidence bands were generated. The model performances for this Pacific patient sample were then compared with the previously reported NZ European sample from the same memory service.11
All analyses were completed in R (version 4.3.2)28
Research Ethics and Informed Consent
Ethical approval for this study was granted by the NZ Health and Disability Ethics Committee (HDEC: 17/NTB/191). The requirement for individual informed consent was waived by the Ethics Committee, as the study involved retrospective analysis of routinely collected, de-identified clinical data.
Results
Sociodemographic and clinical characteristics
A total of 204 scans were included in this study. The Pacific ethnicities were Samoan (n=115, 56%), Cook Island Māori (n=40, 20%), Tongan (n=37, 18%), Niuean (n=7, 3%), Fijian (n=2, 1%), Tokelauan (n=2; 1%), and Tuvaluan (n=1, 0.5%). There was no significant difference in brain volumes between the three major groups of Pacific peoples (Samoan, Cook Island Māori and Tongan) after adjusting for dementia status, age and TIV: TBV (p =0.460), HV (p=0.616), GMV (p=0.742) and WMV (p=0.253). Table 1 presents the sociodemographic and clinical characteristics of the sample. The distribution of NZDep scores were similar across the dementia and non-dementia: in both groups the majority had high-deprivation scores (NZDep deciles 8–10).
Brain volumes
Mean CTseg brain volumes (TBV, HV, GM, and WM) stratified by sociodemographic and clinical characteristics are presented in Table 2. Compared to the non-dementia group, the dementia group had significantly smaller TBV, HV, GM and WM volumes, and these findings remained after adjusting for TIV and age.
The brain volumes, sociodemographic and clinical characteristics of the NZ European sample reported previously11 are presented in Supplementary Table S1. Comparisons of brain volumes between Pacific and NZ European dementia and non-dementia groups showed no significant differences after adjustment for TIV and age (Supplementary Table S2).
Model performance
As shown in Table 3, the TBV, HV and combined volumes (incorporating TBV, HV, GM and WM) models each demonstrated moderate diagnostic performance with AUCs ranging from 0.75 to 0.81 for the Youden index (optimal threshold). Although the combined volumes model achieved the highest AUC, the confidence intervals overlapped across all models, indicating no significant difference in model performance. Across all models, the interaction between NZDep and brain volume measures was not statistically significant. Increasing the classification threshold from 0.5 to 0.9 resulted in progressively higher specificity and positive predictive value (PPV), at the expense of reduced sensitivity and negative predictive value (NPV).
Figure 2 presents the ROC curves and diagnostic accuracy outputs for the classification of dementia versus non-dementia. Logistic regression results and model diagnostics are presented in Supplementary Tables S3 and S4.
Discussion
Our findings demonstrate that the CTseg software successfully generated brain volume estimates and performed well in distinguishing dementia from non-dementia in a sample of Pacific patients.
Brain volumes
As expected, mean brain volumes (total brain, hippocampal, grey matter and white matter volumes) were lower in the dementia group compared with the non-dementia group, and lower in those with moderate severity compared to those with mild severity dementia. All mean brain volumes for Alzheimer’s dementia were lower than those for mixed dementia, which were lower than those for vascular dementia, but reached statistical significance only for hippocampal volume (p=0.034). Subtype differences in brain volume should be interpreted cautiously, as the original CT scans were visually reviewed as part of the clinical diagnostic process, raising the possibility of circularity (incorporation bias).
Model performance
The CTseg-derived total brain volume performed reasonably well in detecting dementia (Table 3). We might have expected the combined model to have greater diagnostic accuracy. This was not the case and may be due to multiple highly correlated brain volumes, which may increase the risk of model overfitting without materially improving discrimination.29
Comparison with European sample
We compared our findings with those of the European sample described in our earlier publication.11 We previously reported performance in the European sample at threshold 0.5 for CTseg derived TBV (AUC 0.68, 95% CI: 0.60–0.76), HV (AUC 0.72, 95% CI: 0.64–0.80), and combined volume (AUC 0.74, 95% CI:0.66–0.81). The sample of Pacific patients had higher reported AUCs for all models, but the 95% confidence intervals for both groups overlapped. For example, the AUC for the combined volume model at threshold 0.5 in Pacific patients was 0.81 (95% CI: 0.75-0.87), whereas the AUC for the same model at the same threshold in the European sample was 0.74 (95% CI:0.66–0.81).
Compared to the NZ European sample, the sample of Pacific patients showed higher sensitivity but lower specificity across all models. The lower specificity in the Pacific sample might reflect the smaller sample size and greater class imbalance, with non-dementia cases comprising only 37.7% of the sample compared with 47.0% in the European sample. In logistic regression, such class imbalance can bias models toward the majority class, which in this case is the dementia class, resulting in higher sensitivity but reduced specificity.30 An alternative explanation is that some Pacific individuals without a dementia diagnosis may have structural brain changes for other reasons (e.g., cerebrovascular disease), leading to apparent false-positive classifications. Socioeconomic deprivation has been associated with greater brain atrophy,31,32 but it was not possible to adequately test for this interaction in our sample due to a lack of heterogeneity (72% of the sample categorized as high socioeconomic deprivation). The differences in diagnostic accuracy might also be explained by the higher proportion of MCI cases within the non-dementia group in the Pacific sample compared to European sample (70.1% vs 50.6%). As brain atrophy, especially hippocampal atrophy, is an early feature of dementia that can be pronounced in MCI, it reduces the model’s ability to distinguish between groups.33 To ensure that we were not misdiagnosing dementia as MCI, we calculated the proportion of individuals with MCI in both groups who subsequently converted to dementia. We found similar conversion rates in both groups, suggesting that the diagnoses of MCI reflect comparable positions along the dementia continuum.
Comparison with other studies
We also compared our findings with the only other similar study evaluating CTseg in the detection of dementia.34 Their analysis differentiated 70 individuals with dementia from 72 individuals with MCI recruited from a Singaporean memory clinic, using a composite diagnostic score derived from seven brain volumetric measures. Diagnostic performance was high, with an area under the curve (AUC) of 0.95 and approximately 90% sensitivity and 90% specificity (estimated from the published ROC curve).34 The diagnostic accuracy observed in our study is comparatively lower, likely reflecting our consecutive real-world sampling, resulting in greater heterogeneity of dementia subtypes, which will dilute diagnostic accuracy.
Strengths and limitations
The key strength of this study is the use of a real-world consecutive memory-service sample of Pacific peoples, a population underrepresented in neuroimaging research. Diagnoses were established through multidisciplinary clinical consensus, enhancing diagnostic validity. Although CTseg outputs were not available to clinicians at the time of diagnosis, the original CT scans had been visualised by the memory service team as part of the diagnostic work-up and therefore incorporation bias may have occurred, potentially inflating associations. Additionally, the small number of patients without dementia may have contributed to class imbalance, and consequent low specificities.
The greater proportion of Pacific patients with later-stage dementia may reflect inequity in timely access to specialist assessment for Pacific peoples living in NZ.35 Pacific peoples are under-represented in clinical datasets as they are disproportionately affected by barriers to diagnosis and specialist referral. This creates a “Catch-22” in health research: the same inequities that limit access to diagnostic services also reduce Pacific peoples’ visibility in research datasets, making it more challenging to develop and validate tools tailored to their needs. As a result, researchers aiming to assemble larger, representative samples are constrained by these systemic inequities, which may inadvertently widen evidence gaps and perpetuate unequal health outcomes.
Implications for clinical practice and future research
We observed no significant differences in brain volumes among the three largest Pacific ethnic groups (Samoan, Cook Island Māori, and Tongan), further supporting the potential generalizability of these volumetric markers within Pacific populations. The broadly similar brain volumes observed between the European and Pacific samples, together with comparable overall model performance, also suggest that a combined volumetric model may be applied across populations without requiring ethnicity-specific volumetric thresholds, however this needs to be further tested and replicated in independent samples.
A greater proportion (37%) of patients had moderate severity dementia in the Pacific sample compared to 10% of the European sample, despite the mean age being up to eight years younger. These findings are in keeping with previous studies which have shown that Pacific patients have a more severe dementia at the time of diagnosis and develop dementia at a younger age.7,9 Opportunistic identification of brain changes in CT scans conducted for other reasons (for example, after a fall) might facilitate more timely detection of dementia in Pacific peoples, supporting access to services and potential treatments.
Although the model’s diagnostic performance is not yet sufficient for standalone clinical use, it may be valuable as part of a multimodal case-finding or triage framework that integrates CTseg-derived volumetric measures with routinely collected electronic health data. Machine learning models that use routine health data, including comorbidities, health service utilization, laboratory results, and medication history have reported high AUC values.36 In this context, the high sensitivity observed in the Pacific sample may be advantageous for identifying individuals at increased risk of dementia, who could then be prioritized for further assessment and streamed into memory services for comprehensive evaluation. Such an approach could support earlier detection and improve diagnostic equity for Pacific populations while remaining cost-effective for the health system, as it leverages routinely acquired CT imaging and existing electronic health records rather than expensive or invasive biomarkers such as amyloid PET imaging or cerebrospinal fluid assays. This approach requires further investigation. High sensitivity is useful for case-finding, but the implications of low specificity must be considered carefully as a high false-positive rate can place an unnecessary burden on health services and lead to avoidable stress, and potential stigma for patients.37,38
Future research should aim to evaluate CTseg in larger, ethnically diverse, more balanced, and multi-modal datasets to ensure more stable and generalizable model performance. In addition, future studies should formally assess subtype-specific performance, various brain regions and systematically examine the impact of scanner-related variability on volumetric outputs and model robustness. Finally, investigating the relationship between socioeconomic deprivation and brain volumes warrants further study. This association could not be robustly evaluated in the present cohort, given that the majority of Pacific peoples (≈72%) reside within areas characterized by high socioeconomic deprivation (NZDep 8–10).
Conclusion
Evaluating the accuracy of CTseg software for the detection of dementia in an ethnically distinct sample of Pacific peoples living in NZ, CTseg demonstrated diagnostic performance comparable to that previously observed in a sample of NZ European patients. These findings extend the generalizability of our earlier work and provide support for CT-based volumetry as a scalable and pragmatic dementia case-finding tool that can be readily integrated into existing clinical workflows and utilized across diverse NZ populations.
Acknowledgments
The Picture Archiving and Communication System (PACS) team, the patients and team members of Te Kahu Mahara (Memory Service), at Te Whatu Ora - Counties Manukau, South Auckland, NZ
Author contributions
Y Mukish M Yelanchezian (Conceptualization; Methodology; Formal Analysis; Data Curation; Visualization; Investigation, Writing – Original Draft), Etuini Ma’u (Writing- Review & Editing, Methodology), Bede Oulaghan (Data Curation), Susan Yates (Data Curation) , Gill Dobbie (Supervision), Gary Cheung (Writing- Review & Editing), Sarah Cullum (Conceptualization; Supervision; Methodology; Writing- Review & Editing; Funding Acquisition; Project Administration)
Disclosures
The authors declare no potential conflicts of interest with respect to the research, authorship, and/or publication of this article. The authors have no financial interests to disclose, no personal relationships that could have appeared to influence the work reported in this paper, no patents or intellectual property related to this research, and no other conflicts of interest.
Funding
This study was supported by funding from the Health Research Council of NZ (HRC).