INTRODUCTION
The interplay between adiposity, weight loss, and brain structure is complex, and associations may be affected by type 2 diabetes (T2D) and obesity or overweight.1–4 In this manuscript we focus on four cytokines – adiponectin, leptin, interleukin-6 (IL-6), and vascular endothelial growth factor (VEGF)– that may play a role in these interrelated processes because they are known to be neuroactive, related to obesity and T2D, and to fluctuate with weight change. We explore the associations that plasma concentrations and changes in plasma concentrations of these hormones have with brain volumes in a diverse cohort of middle-aged adults with T2D and obesity or overweight.
Adiponectin is a hormone that regulates energy metabolism and increases insulin sensitization.5,6 Individuals with obesity tend to have lower concentrations of plasma adiponectin.7,8 However, diet-induced weight losses have not been consistently related to increases in plasma adiponectin concentrations.5,9,10 Adiponectin has neuroprotective properties linked to anti-inflammation, anti-oxidation, neurogenesis, and increased neural plasticity.6,11 There are inconsistent reports whether higher concentrations are associated with better cognitive function.6,8,12 However, higher adiponectin levels have been related to increased levels of neurovascular disease and, among individuals without obesity, smaller brain volumes.13
Leptin is a hormone that regulates satiety and hunger. It is mainly produced in white adipose tissue and circulating levels are commonly elevated among individuals with obesity and are positively correlated with total body fat.7,14–17 Conversely, leptin may also prevent obesity by promoting satiety.6 Diet- and surgery-induced weight losses tend to lower concentrations.5,9,14,18 Higher leptin concentrations are associated with lower levels of brain atrophy, less neurodegeneration, better synaptic transmission, and neurogenesis by some reports.7,19–21 Others report that elevated serum levels are associated with lower brain volumes, perhaps by increasing inflammation and endothelial dysfunction.8,22,23 Reported associations between circulating leptin levels and cognitive function and impairment are mixed and may be moderated by obesity, which impairs the blood-brain transport of leptin.8
Neuroinflammation is a key mechanism in neurodegeneration,24 but the contribution of the inflammation prevalent in T2D to neurodegeneration is not clear.25 IL-6 is a proinflammatory cytokine. IL-6 concentrations are increased with obesity and diet-induced weight loss tends to lower concentrations.9,26 Higher concentrations of plasma IL-6 are associated with increased brain metabolism, increased inflammation in the brain, cognitive deficits, accelerated brain atrophy, and increased risk for dementia.27–29
VEGF is a proangiogenic cytokine. Its concentration tends to be relatively higher among individuals with obesity and decreases with diet-induced and surgical weight loss.18,30–33 VEGF crosses the blood brain barrier and is also produced by astrocytes in the brain.34 VEGF has been reported to have neuroprotective properties associated with angiogenesis, vasculogenesis, and possibly neurogenesis.34,35
To better understand how circulating cytokine concentrations and changes in concentrations are interrelated and associated with brain volumes among individuals with T2D and fluctuating levels of obesity, we used data from the Action for Health in Diabetes (Look AHEAD) research program. These data allow us to examine the impact of intentional weight loss on brain health from the framework of experimental design. The Look AHEAD interventions were designed to produce intentional weight loss through caloric restriction, increased physical activity, and intervention sessions,36 thus providing a temporal orientation for the associations we describe which cannot be ascertained from observational studies.
OBJECTIVE
We sought to address the following questions. To what degree are changes in body mass index (BMI) associated with changes in cytokine concentrations? Are brain volumes (total, gray, and white) associated with plasma concentrations and changes in plasma concentrations of these four weight-sensitive cytokines? Do changes in BMI account for any associations that changes in cytokine concentrations have with brain volumes and/or do changes in BMI alter associations that cytokine concentrations have with brain volumes? Did enrollment in an intensive lifestyle intervention focused on weight loss lead to long-term changes in cytokine concentrations and did the intervention account for any of their associations with brain volumes?
METHODS
Participants
Data come from volunteers for the Look AHEAD randomized controlled clinical trial. Its study design and methods have been published previously.37 Participants were recruited (in 2001-2004) at 16 clinical sites within the United States. Major eligibility criteria included: age 45 to 76 years, T2D, BMI >25 kg/m2 (>27 if taking insulin), ability to complete a maximal exercise test, and having a primary care provider. Look AHEAD participants at three clinical sites were enrolled in an ancillary study of magnetic resonance imaging (MRI) that measured brain volumes at the conclusion of the trial.38 Plasma for cytokine assays were collected as part of the Look AHEAD MIND ancillary study.39 Our analyses are limited to 223 Look AHEAD participants who participated in both ancillary studies. All data were collected by centrally trained and certified staff who were masked to intervention assignment. Protocols were approved by local Institutional Review Boards and all participants provided written informed consent. We note that the Look AHEAD cohort differs from others contributing to the literature in that it provides long term follow-up of participants undertaking a successful weight loss intervention, many of whom had high levels of obesity.
Interventions
Participants were randomly assigned with equal probability to a 10-year intensive lifestyle intervention (ILI) or a diabetes support and education (DSE) condition. The goal of ILI was to produce and maintain a mean 7% weight loss by reducing caloric intake (goal of 1,200 to 1,800 kcal/d) and increasing physical activity (goal of 175 min/wk of moderate intensity activity). To achieve these changes, the intervention included both group and individual sessions with weekly sessions during months 1 to 6 and then gradually decreased contact, which remained at least monthly throughout. In years 2-8, the intervention focused on maintaining weight loss and the duration of physical activity achieved during year 1, as well as helping unsuccessful individuals reach the study goals.40 DSE participants received three sessions per year, focused on diet, exercise, and social support.41 They did not receive the comprehensive components of the intervention or specific strategies for weight loss. In our primary analyses, we pool data from both intervention groups because, as described below, the intervention had no long-term material effect on plasma concentrations of or changes in plasma concentrations of these four cytokines.
Participant descriptors
Weight and height were measured in duplicate using a digital scale and stadiometer to determine BMI. Glycosolated hemoglobin (HbA1c) was assayed centrally from blood samples collected while participants were fasting. Demographic and medical history data were based on self-report.
Brain Magnetic Resonance Imaging
Single cross-sectional MRI scans were collected at three clinics (Philadelphia, Pittsburgh, and Providence) 10.2 to 13.2 years after Look AHEAD enrollment38 using standard procedures. Structural brain MRIs were obtained according to protocols that have been successful in prior studies and provided standardized measures of overall and region-specific brain volumes that have been validated. The MRI Reading Center at the University of Pennsylvania administered quality control based on the ACR MRI Quality Control Program. This featured weekly scans of the ACR/NEMA QC phantom.
Cytokine Assays
Cytokine assays were measured centrally from stored frozen plasma samples at Medpace, Inc., Cincinnati, Ohio. These were collected at Look AHEAD baseline and near the termination of the trial (range 7.9 to 13.9 years post-randomization; median=10.0 years) in fasting participants.39
Total adiponectin concentrations in plasma samples were assayed with a monoclonal antibody-based quantitative sandwich enzyme immunoassay kit (R&D Systems Inc.). The assay sensitivity was 0.63 µg/mL and the reference range is 0.87 to 21.42 ug/mL. Three quality control samples with low, medium and high concentrations of adiponectin were analyzed in each ELISA plate; between assay CVs were 7.2%, 10.2%, and 6.4% respectively.
Leptin concentrations in plasma samples were assayed with a monoclonal antibody-based quantitative sandwich ELISA kit (R&D Systems, Inc.). The assay sensitivity was 1.56 ng/mL and the reference range was 1.0 to 50.0 ng/mL. Three quality control samples with low, medium, and high concentrations of leptin were analyzed in each plate; between assay CVs were 2.9%, 1.6%, and 1.6% respectively.
Plasma concentrations of IL-6 were assayed with a monoclonal antibody-based solid-phase ELISA method (R&D Systems, Inc.). The assay sensitivity was 0.156 pg/mL and the reference range was 0.86 to 5.20 pg/mL. Three quality control samples with low, medium, and high concentrations of IL-6 were analyzed in each plate; between assay CVs were 4.6%, 2.4%, and 3.0% respectively.
VEGF plasma concentrations were assayed with a monoclonal antibody-based quantitative sandwich ELISA kit (R&D Systems Inc.). The assay sensitivity was 50.0 pg/mL and the reference range was 62 to 707 pg/mL. Three quality control samples with low, medium, and high concentrations of VEGF were analyzed in each plate; between assay CVs were 5.6%, 4.4%, and 4.3% respectively.
Statistical Analysis
Cytokine concentrations were right-skewed and the distributions included a few stray outliers. To address these issues, we used logarithm transformations and 1% Winsorization (values outside of the 1st and 99th percentiles were replaced with values at these percentiles). We used the average of and changes between the log-transformed cytokine concentrations (i.e., at baseline and at the trial’s end) as predictors of the cross-sectional brain volumes. Relationships between these measures and brain volumes were assessed with linear models that included intracranial volume and age at MRI. The linearity assumption appeared to be appropriate based on scatterplots. Additional models were fitted that included BMI and intervention assignment.
RESULTS
The cohort (N=223) averaged 57.4 (SD=6.4) years at baseline, 67.9 (6.0) years when the follow-up bloods were drawn for cytokine assays, and 68.5 (6.4) years when the cross-sectional MRIs were obtained. The time between the MRI and follow-up blood collection averaged 0.64 [IQR -0.95 to 1.40] years. The cohort was evenly divided between intervention assignments: N=107 (48%) assigned to DSE and N=116 (52%) assigned to ILI; 73% were female and baseline BMI averaged 35.5 (5.6) kg/m2. Additional information on baseline characteristics appears in Table S1.
There was little difference between intervention groups with respect to the follow-up times for the MRI (mean 11.1 years for both DSE and ILI; p=0.41). Blood collections occurred slightly later among DSE (mean 10.7 years) than ILI (10.3 years) participants: p=0.06. Times between MRI and blood collections tended to be shorter for DSE (mean 0.40 years) than for ILI (0.87 years) participants: p=0.03. Overall mean (standard deviation) of total brain volume in the cohort was 1097 (107) cc divided between 494 (55) cc white matter and 602 (60) cc gray matter. The mean intracranial volume was 1300 (129) cc. As seen in Table S2, there were only minor differences between intervention groups in concentrations of and changes over time in cytokines and in brain volumes, which supports pooling data across intervention groups.
Table 1 lists plasma cytokine concentrations at baseline and follow-up. Over the mean 10.5 (1.6) years between measures, adiponectin and leptin concentrations remained fairly constant; the concentration of IL-6 tended to rise (the exponent of the mean log difference was 1.17 [95% confidence interval 1.07, 1.27]), and the concentration of VEGF decreased by a factor of 0.88 [0.83, 0.94].
Table 2 lists correlations between log-transformed cytokine concentrations at baseline and between changes in these concentrations over time. At baseline, concentrations of adiponectin and IL-6 were negatively correlated (r=-0.18; p=0.007), concentrations of IL-6 and leptin were positively correlated (r=0.37; p<0.001), and concentrations of leptin and VEGF were positively correlated (r=0.17; p=0.02). Over time, changes in adiponectin and leptin were negatively correlated (r=-0.17; p=0.01) and changes in IL-6 and leptin were positively correlated (r=0.15; p=0.03).
Table 3 lists results from regression analyses linking cytokine concentrations (averaged over baseline and follow-up) and changes in cytokine concentrations (between baseline and follow-up) to brain volumes with covariate adjustment for intracranial volume and age at MRI. Mean (log-transformed) adiponectin concentrations across follow-up were not related to brain volumes; however, increases in adiponectin concentrations from baseline were associated with greater total brain volumes (β=2.14 [95% confidence interval 0.50, 1.94]). Mean log-leptin concentrations over follow-up were positively associated with white matter volumes (β=2.00 [0.06, 6.92]), however changes in leptin concentrations were not related to brain volumes. Mean IL-6 concentrations over time were negatively associated with total and gray matter volumes (β=-3.00 [-14.82, -3.07]) and (β= -2.96 [-16.37, -3.29]) respectively, however, changes in IL-6 were not associated with brain volumes. Mean VEGF concentrations over follow-up were negatively associated with total brain volumes (β= -2.79 [-10.08, -1.74]) however changes in VEGF concentrations over time were not associated with brain volumes.
As seen in Table S3, these relationships were not materially attenuated after covariate adjustment for baseline BMI and changes in BMI, although the confidence interval for the association between leptin and white matter volumes no longer excluded 0.
Overall, the most proximal measure of BMI preceding the MRI averaged 33.3 (5.5) kg/m2. This reflected a mean change from baseline of -2.2 (3.4) kg/m2. Table S4 lists correlations that cytokines concentrations had with BMI at baseline and correlations that changes in cytokine concentrations from baseline to follow-up had with changes in BMI. Baseline concentrations of leptin (r=0.56) and Il-6 (r=0.41) were both positively associated with baseline BMI (p<0.001). Increases in both leptin (p=0.54) and IL-6 (r=0.26) concentrations were associated with increases in BMI over time (p<0.001). Increases in VEGF concentrations had modest positive associations with changes in BMI (r=0.14; p=0.04).
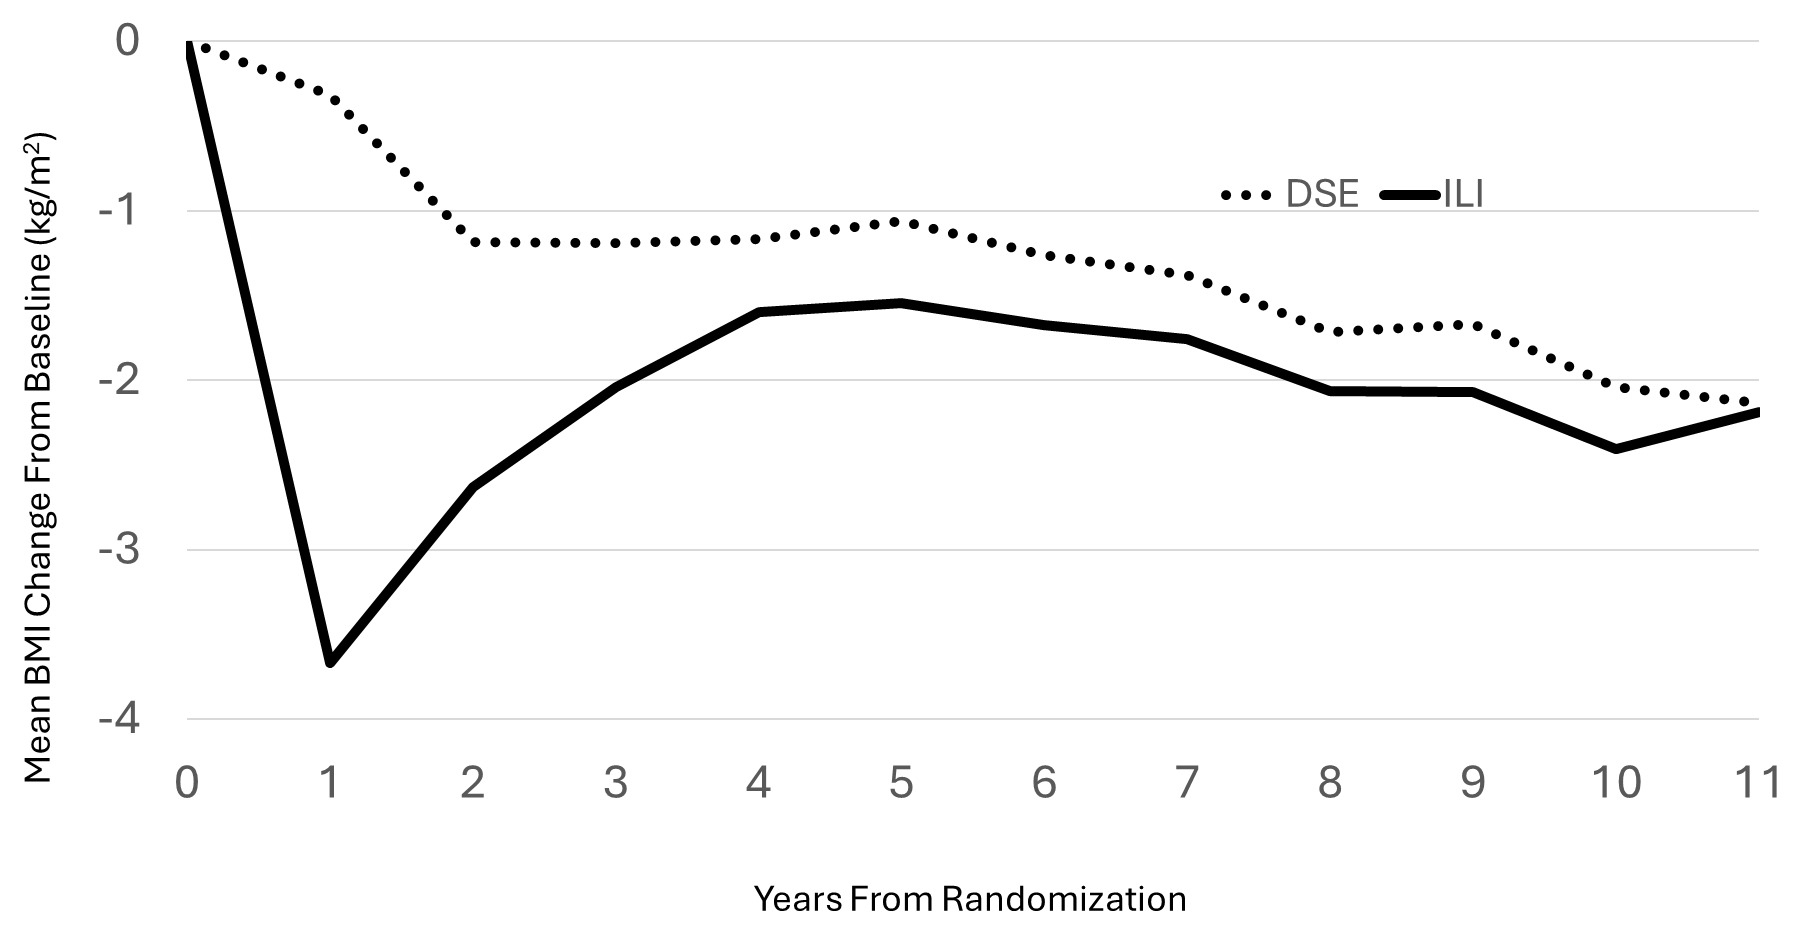
Randomization produced balances between intervention groups at baseline with respect to BMI, age, and intervention group assignment that extended to the subset of participants contributing to these analyses. At the time of MRI, there was little difference in mean BMI changes from baseline between intervention groups in this subsample: mean (SD) for DSE -2.1 (3.7) kg/m2 versus ILI -2.2 (3.2) kg/m2 (p=0.87). As seen in Figure 1, there were differences in BMI between intervention groups earlier during follow-up (and the mean BMI across follow-up averaged 0.83 [95%CI 0.09, 1.56] kg/m2 less among ILI versus DSE participants (p=0.03), however these differences had attenuated during longer follow-up.

There were no material differences between intervention groups at baseline, follow-up, and for changes over time for any of the cytokine concentrations (all p>0.15; Table S5). There were no differences in brain volumes between intervention groups in this cohort. Total brain volumes (with adjustment for intracranial volume, the means (standard errors) were 1099 (3) cc for ILI versus 1095 (3) cc for DSE (p=0.36). For gray matter the means were 605 (3) cc for ILI versus 601 (3) cc for DSE (p=0.41). White matter means were 494 (2) cc for ILI versus 494 (2) cc for DSE (p=0.97). Covariate adjustment for intervention assignment did not attenuate associations between cytokine concentrations and brain volumes.
DISCUSSION
Our analyses yielded four findings. First, pairwise correlations among cytokine concentrations and changes in their concentrations in the Look AHEAD cohort parallel those reported elsewhere and are reflective of adults with T2D and overweight/obesity. Second, cytokine concentrations and changes from baseline to follow-up in their concentrations had associations with brain volumes consistent with their mechanisms of action. Third, while cytokines had expected associations with BMI, their associations with brain volumes were not materially altered with covariate adjustment for BMI and changes in BMI. Fourth, the 10-year Look AHEAD weight loss intervention did not have a sustained impact on cytokine concentrations and only a modest and diminishing legacy of relative weight loss in our analytical cohort.
The strongest cross-sectional correlation between cytokines was a positive association between leptin and IL-6. This is likely driven by their joint association with obesity which is evident in the Look AHEAD cohort with positive correlations both with cross-sectional and longitudinal change in BMI. In addition, leptin has been reported to be proinflammatory among individuals with overweight or obesity leading to increased IL-6 concentrations.9,42 The higher concentration of leptin associated with obesity is known to be related to increased synthesis of VEGF,43 which accounts for the observed correlation seen in our data. The negative cross-sectional correlation between adiponectin and IL-6 likely reflects its anti-inflammatory properties and its inverse association with obesity.11 Increases in leptin concentrations over time were associated with increases in Il-6 and decreases in adiponectin, likely capturing the accumulating effects of obesity and increases in BMI on inflammation.
The relationships between cytokine concentrations and brain volumes reflect both neuroprotective and neurodegenerative processes. While others have found little evidence for cross-sectional relationships between adiponectin and brain volumes overall24 or among individuals with obesity,14 adiponectin has a range of neuroprotective properties linked to anti-inflammation, anti-oxidation, neurogenesis, and increased neural plasticity6,11,35 which may account for the finding that increasing concentrations of adiponectin were associated with greater total brain volumes.
The positive association of leptin concentrations with white matter volumes may be related to its neuroprotective properties.6,19 In addition, leptin bioavailability has been linked to better white matter integrity captured by fractional anisotropy.21 However, higher concentrations of leptin have also been associated with smaller gray matter volumes and total brain volumes, perhaps reflecting poorer nutrition, leptin resistance, inflammation, or heightened adipose metabolism,22,23,42 which perhaps may counter-balance the benefits seen for white matter volume.
It is not surprising that higher concentrations of IL-6 are associated with smaller brain volumes given that IL-6 is proinflammatory, higher IL-6 concentrations are related to increased brain atrophy, and IL-6 has been found to mediate the accelerated atrophy associated with T2D.28,44
Raman, et al. reported that higher circulating concentrations of VEGF were associated with smaller brain volumes (although the significance did not withstand correction for false discovery), perhaps as a response to neurovascular damage.45 VEGF is elevated in CSF in response to early Alzheimer’s disease.46 Thus, it may be that the inverse association we see between VEGF and brain volumes represents a response mechanism to cerebrovascular damage accelerated by T2D.
At baseline, higher BMI was strongly associated with higher concentrations of leptin and IL-6, which is to be expected, as both leptin and IL-6 tend to be elevated with obesity. These associations are in accordance with the positive relationships between changes in these cytokines and changes in BMI from baseline to follow-up. There is also some evidence that increases in BMI over time were associated with increases in VEGF, which as noted above may reflect a response to neurovascular damage.
Despite these associations, covariate adjustment for mean BMI over time and changes in BMI over time did not materially alter relationships between cytokines and brain volumes with the exception that the relationship between leptin and white matter volume was attenuated. This may signal that the predominant associations are separable from those driven by BMI and more strongly linked to mechanisms that are not dependent on BMI. It could also be that the timeframes when BMI is mechanistically involved were not captured by our analysis. It is interesting that the BMI changes induced by the Look AHEAD ILI had largely disappeared by the time when the MRI and end-of-trial/follow-up blood samples for cytokine assays occurred. This may account for the lack of differences in cytokine concentrations between intervention groups we see. We note that Look AHEAD reported that ILI was associated with relative increases in adiponectin concentrations at 1 year,10 however these had disappeared by the time our follow-up data were collected. Additional research is needed to understand the time frame of relationships.
Limitations
Our study is strengthened by the randomized control design, masked assessments, and the standardized measurement protocols. We note several limitations. Cytokines were measured at only two time points so that we cannot describe dynamic associations. We lack baseline MRI assessments, and follow-up MRIs were not collected concomitantly with end-of-trial/follow-up blood samples for cytokine concentrations or when BMI was measured. We have not analyzed fine-grain or region-of-interest associations with brain volumes and have not factored in data on cognitive function. As volunteers eligible for and willing to participate in a clinical trial of lifestyle interventions and undergo a brain MRI, our study cohort may have limited representation. While we do not find evidence that the Look AHEAD interventions may have altered the associations we describe, we cannot rule out that there may have been some confounding influences.
CONCLUSIONS
Plasma cytokine concentrations and changes in these concentrations are associated with brain volumes among individuals with T2D and overweight or obesity.
AUTHOR CONTRIBUTIONS
MAE conceived the research, obtained funding, conducted the statistical analysis, and collaborated on writing the manuscript. SY, OTC, KMH, JAL, and DKH collaborated on the design of the project and editing the manuscript. KMH, DKH, LEW, and JAL obtained funding and collaborated on the conception of the project and writing of the manuscript. DPM-H collaborated on the review and editing of the manuscript.
DATA SHARING STATEMENT
Deidentified data for public use are available through the NIDDK Central Repository (https://repository.niddk.nih.gov/home).
DISCLOSURES
MAE and DPM-H have received research funding from the Alzheimer’s Association. JAL has been a consultant to Merck KGaA and Novo Nordisk and receives a stipend from Wolters Kluwer as an Editor in Chief. KMH is Editor in Chief of the Journal of Brain Health and has recused herself from the handling and decisions made regarding this manuscript. The authors report no additional potential conflicts of interest.
FUNDING
The Action for Health in Diabetes is supported through the following cooperative agreements from the National Institutes of Health: DK57136, DK57149, DK56990, DK57177, DK57171, DK57151, DK57182, DK57131, DK57002, DK57078, DK57154, DK57178, DK57219, DK57008, DK57135, and DK56992. Look AHEAD Extended Follow-up (Look AHEAD Aging) was supported by U01AG073697. The Look AHEAD Brain MRI study was funded by DK092237. JAL received funding from K24AG045334.
The following federal agencies have contributed support: National Institute of Diabetes and Digestive and Kidney Diseases; National Heart, Lung, and Blood Institute; National Institute of Nursing Research; National Center on Minority Health and Health Disparities; Office of Research on Women’s Health; the Centers for Disease Control and Prevention; the National Institute on Aging; and the Department of Veterans Affairs.
Additional support was received from the University of Pittsburgh General Clinical Research Center (GCRC) (M01RR000056), the Clinical Translational Research Center (CTRC) funded by the Clinical & Translational Science Award (UL1 RR 024153) and NIH grant (DK046204); and Frederic C. Bartter General Clinical Research Center (M01RR01346).
The following organizations have committed to make major contributions to Look AHEAD: FedEx Corporation; Health Management Resources; LifeScan, Inc., a Johnson & Johnson Company; OPTIFAST® of Nestle HealthCare Nutrition, Inc.; Hoffmann-La Roche Inc.; Abbott Nutrition; and Slim-Fast Brand of Unilever North America.